
Why sampling frequency matters for clean audio and accurate measurements
When you record or measure sound, you are turning a continuous analogue signal into a series of digital samples. If you sample too slowly, high frequency content folds back into the audible range and creates aliasing: artefacts that were never in the original signal.
At Xi Engineering Consultants, we choose sampling frequencies that match the true frequency range of interest, so audio and noise measurements are trustworthy and free from aliasing errors.
What audio aliasing is
When an analogue signal is digitised, you record its amplitude at regular time steps. The sampling frequency is how many of these samples you take per second. CD audio, for example, uses 44.1 kHz – 44,100 samples per second.
Aliasing happens when the sampling frequency is too low for the content you are trying to capture. Different analogue signals can then produce the same set of samples. They become aliases of each other, and the digital signal no longer represents the original correctly.
The Nyquist sampling theorem gives a simple rule:
To avoid aliasing, your sampling frequency must be at least twice the highest frequency you want to represent.
So with a 44.1 kHz sampling rate, you can represent frequencies up to 22.05 kHz without aliasing, comfortably above the upper limit of human hearing.
The cosine wave example
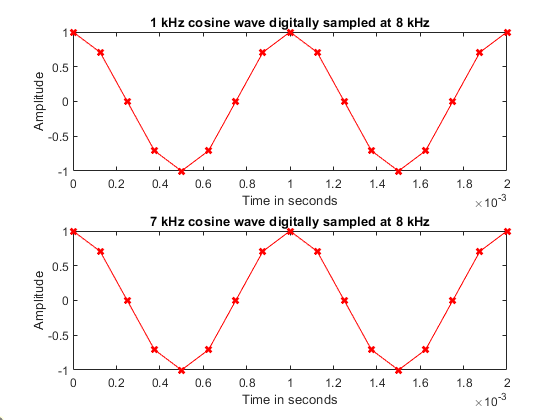
If we take an example of two analogue cosine waves, one with a frequency of 1 kHz and the other with a frequency of 7 kHz. These cosine waves have then both been sampled at 8 kHz – the sampling points are represented by the red crosses:

Now if we take away the original analogue signal and just plot the sampled digital signal:

It can be seen that the 1 kHz cosine wave still bears a resemblance to the original analogue version, but the 7 kHz cosine wave has changed! Worse, it appears identical to a 1 kHz cosine wave, it’s alias.
If we apply the Nyquist theorem to our 1 kHz cosine wave, 1 kHz x 2 = 2 kHz, we can see that 2 kHz is less than the 8 kHz sampling frequency that was used, therefore according to the Nyquist theorem, the 1 kHz signal is sufficiently represented.
If we apply the Nyquist theorem to our 7 kHz cosine wave, 7 kHz x 2 = 14 kHz, we can see that 14 kHz is higher than the 8 kHz sampling frequency that was used, therefore according to the Nyquist theorem, the 7 kHz signal will not be sufficiently represented, and that’s why we don’t see a 7 kHz signal after sampling.
The spinning wheel effect eXA
Aliasing can also be observed in a more visual way, described as the wagon wheel effect. This takes its name from its common occurrence on wagon wheels in classic Western films, but it is also often observed on films of helicopter blades or car wheels.

Each frame of the film is captured at a set point in time, which means that if the first frame shows the wheel spokes in one position and then the wheel rotates at such a speed that when the next frame is captured the when spokes are in the same position, then the result will be a film in which the wheels look as if they are stationary or slowly moving.
Why this matters for real measurements
The right sample rate depends on what you are measuring:
- Low frequency seismic data – a relatively low sampling rate can be fine.
- Noise most audible to humans – higher sampling rates are needed to capture all relevant frequencies.
- Wildlife or specialist cases – some species hear well into the ultrasonic range, so measurement systems must go much higher again.
At Edinburgh Zoo, for example, Xi assessed the impact of construction next to noise sensitive animals. Pandas have extended high frequency hearing, so measurements had to use carefully chosen, high sampling rates to capture the sounds that actually mattered to them.
How Xi designs measurement that avoids aliasing
No two measurements are the same. Xi Engineering Consultants:
- Selects sampling frequencies based on the true target frequency range and species or audience of interest.
- Uses high quality measurement equipment and front end filtering to prevent aliasing at the hardware stage.
- Designs acquisition and analysis methods tailored to your project, from building acoustics and environmental noise to specialist audio and ultrasonic work.
The result is data you can trust and decisions based on what is really happening, not artefacts.