Sound Pressure Level is a quantity used to represent the amplitude of sound, but the perception of loudness does not necessarily directly depend on Sound Pressure Level. It is important to address this in the acoustic consultancy work that we do at Xi Engineering Consultants, for example in Noise Impact Assessments, Workplace Noise Assessments, or even when protecting Edinburgh Zoo’s pandas from noise.
What is Sound Pressure Level and how is it defined?
Sound Pressure is defined as the deviation of pressure from the local ambient atmospheric pressure, caused by a sound wave. It is measured in the SI unit for pressure, Pascals (Pa).
Sound Pressure Level (not to be confused with Sound Pressure) is defined as 20 times the base 10 logarithm of the ratio of the Sound Pressure to a Reference Pressure. This Reference Pressure is most commonly defined as 20 μPa, which is the lowest Sound Pressure that is possible for humans to hear. Sound Pressure Level is measured in Decibels (dB), often written as dB SPL or dB re. 20 μPa in order to clarify the Reference Pressure that has been used.
This conveniently means that 0 dB SPL is the lowest Sound Pressure Level that it is possible for humans to hear. The highest Sound Pressure Level that humans can hear without experiencing pain is around 120 dB SPL, or 20 Pa. There is a factor of one million between the quietest and loudest sounds that humans can hear, which means it is useful to express information about sound in Decibels rather than Pascals.
Frequency weighting – What are A, C & Z frequency weightings?
Sound Pressure Level is a good way to express information about the physical phenomenon of sound, but how does that compare to what is actually perceived by humans? Humans can perceive sound from frequencies between 20 Hz and 20 kHz. The inaudible sound below 20 Hz is called Infrasound and sound above 20 kHz is called Ultrasound, however, human perception is not as straight forward as simply being unable to hear sound above or below those two limits. Humans are insensitive to low frequency and high-frequency sounds and sensitive to sound in the middle range of frequencies – from 1 kHz to 4 kHz. The lower or higher the sound outside of the middle range, the less sensitive we are.
In order to better account for human perception of sound when stating Sound Pressure Levels, A-weighting can be applied, which decreases the level of high and low-frequency components of a sound and slightly increases it in the middle range.
A-weighting is very commonly used when describing the sound and is denoted by an ‘(A)’ or ‘A’ after the ‘dB’. For example, when you are told that a sound has a level of ’45 dB(A)’, what that means is ‘45-decibels-with-reference-20-micro-pascals-with-the-low-and-high-frequency-components-of-the-sound-reduced-by-A-weighting’, but people look at you strangely if you use the long-form, so it’s probably better to stick to ’45 dB(A)’.
C-weighting is less far less commonly used. When compared to A-weighting it applies a smaller reduction of low frequencies and a slightly larger reduction in high frequencies, which accounts for the effect that when the overall sound pressure level is high, humans are more sensitive to low frequencies than when the overall sound pressure level is lower. C-weighting is hence often used for expressing high sound pressure levels, for example when there are sudden high amplitude impulses of sound.
B- and D-weighting have largely fallen out of favour but sought to describe the same effect as C- weighting in different ways. Z- weighting is seen on sound level meters and essentially prescribes a flat response in the frequency range audible to humans, in other words, no weighting.
The following figure compares Z, A, B, C and D frequency weighting curves for the frequency range audible to humans (20 Hz – 20 kHz). Frequency weighting curves show the attenuation which is applied by frequency weighting to any given frequency component – for example, A-weighting applies an attenuation of approximately -20 dB at 100 Hz.

Comparison of A-weighting, B-weighting, C-weighting, D-weighting and Z-weighting curves for the audible frequency range
What is time weighting and how is it used in sound level meters?
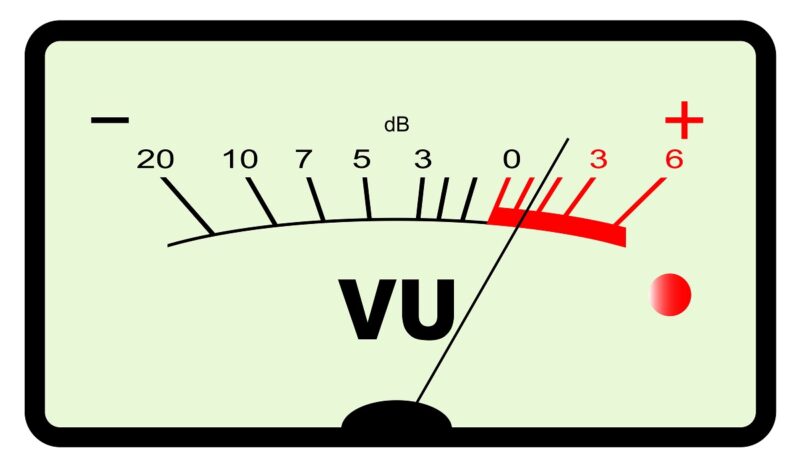
Is that the end of the story? No, but that would be too easy. Time weighting originates from a time when sound level meters consisted of a needle moving up and down a scale. With no time weighting, the needle would bounce around very quickly, trying to display the instantaneous sound pressure level, which is very difficult to read. With time weighting applied, the needle reacts more slowly to changes in instantaneous sound pressure level and so provides a reading which is far easier to read. Time weighting also attempts to account for how humans perceive changes in instantaneous sound pressure level.

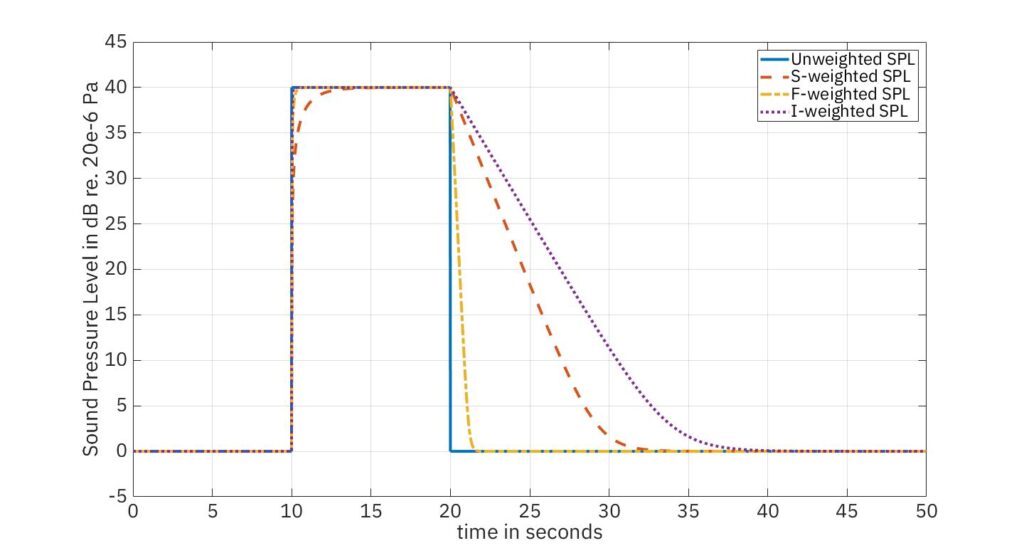
F-time weighting or Fast-time weighting uses a time constant τ of 0.125 seconds – which means the measurement will react quickly to changes in instantaneous sound pressure level.
S-time weighting or Slow-time weighting uses a time constant τ of 1 second – which means the measurement will react slowly to changes in instantaneous sound pressure level.
I-time weighting or Impulse-time weighting uses a time constant of 0.035 seconds for rising sound pressure level and 1.5 seconds for falling sound pressure level – which means the measurement will react very quickly to increases in instantaneous sound pressure level but very slowly to decreases in sound pressure level. This is similar to how the loudness of sudden, high amplitude noises are perceived by humans.
Pk-time weighting or Peak-time weighting applies no time constant. Peak values reflect the true maximum value that the sound pressure level reaches. This is often used in measurements where sudden, high amplitude noises are present.
The following figure shows the unweighted sound pressure level of a sound which is at 0 dB SPL for 10 seconds, sharply rises to 40 dB SPL for 10 seconds, then falls to 0 dB again. When weighted, it can be seen that it takes time for the sound pressure level to ‘react’ to changes when compared to the unweighted sound pressure level.

Comparison of S-weighting, F-weighting and I-weighting applied to a sound which suddenly changes
Panda perception of noise vs humans
It’s all well and good being diligent about representing human perception in our noise measurements, but what about panda perception? Yes, panda perception.
Pandas are particularly sensitive to high-frequency noises and can hear up to 70kHz – more than three times as high as humans. Xi Engineering Consultants acted as acoustic consultant to the Royal Zoological Society of Scotland, advising on the impact of construction work at a proposed development at the former Corstorphine Hospital, adjacent to Edinburgh Zoo, the home of some high-frequency-noise-vulnerable pandas. This sensitivity to high frequencies had to be taken into account when designing noise mitigation to protect the pandas during the demolition and construction phase of the development.
Acoustic Measurement Services – How Xi Can Help
Xi’s team of engineers have years of experience in acoustic measurement and can assist at all levels of complexity. The range of measurements that Xi can perform range depending on the industry, some examples are:
- Noise assessments for both industrial and commercial purposes following standards such as BS 4142, BS 5228, IEC 61400 and ETSU R97.
- Acoustic assessment of industrial machinery.
- Architectural and building acoustic assessment from noise mitigation to partition and transmissibility assessments.
- Environmental acoustic assessments which include noise propagation mitigation as well as pre-planning acoustic assessments.
- Background acoustic assessments.
- Noise at work assessments
Feel free to contact us and one of our experienced sound engineers will get in touch with you to discuss your project.


